What is Systems Mapping?
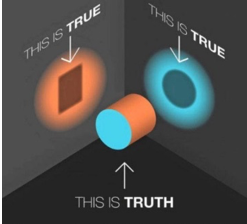
Systems mapping is a tool used to gain shared understanding of a complex social issue. These issues are so big and have so many aspects to them that not one person or group can see the full picture. Systems mapping is an approach to help us try and combine our perspectives to discover how the system truly operates.
What is a Systems Map?
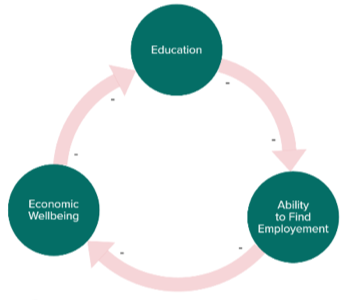
A systems map is a visual representation of cause-and-effect relationships. These relationships fold back onto themselves, creating “loops.” Each loop tells a story explaining why we see repeated patterns in our society that can get either better, worse, or stay the same. These patterns continue to exist because they feed themselves!
In the example below, we see the less education someone has, the less able they are to find employment. And, the less able they are to find employment, the less their economic well-being. And the less their economic well-being, the less able they are to afford a good education. Therefore, the cycle continues, worsening over time.
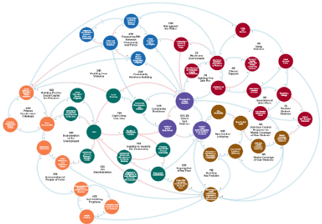
Loops are connected to other loops. And just as a loop feeds itself, all the loops also feed each other. This explains why the issue we are dealing with is so hard to solve. Attempts to fix one problem are undermined by other connected problems.
We can create a visual of all the loops connected, in order to see how everything comes together. We call this visual a systems map. We use the term systems (plural) because the issue we are dealing with spans more than one system (economy, education, etc.). By seeing the whole picture, we can have a better idea of where to focus our efforts. Moreover, the map helps people working in different areas (or in different systems) “get on the same page” and work with each other more effectively.
The Process
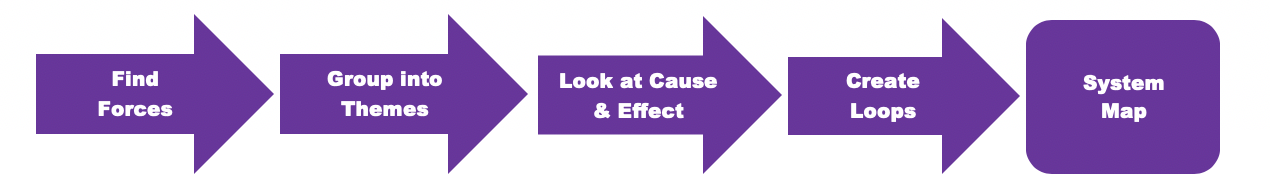
We will find what forces enable (help) and inhibit (hurt) the situation, and then group together similar forces into themes. We will then look at a theme’s causes and effects, and then use that work to help us create the loops we need for our map.
Our Framing Question
We begin by asking ourselves a question of what is helping or hurting our effort?
For this workshop, the question being asked is:
“What helps or hurts girls of color from excelling in science and tech?”
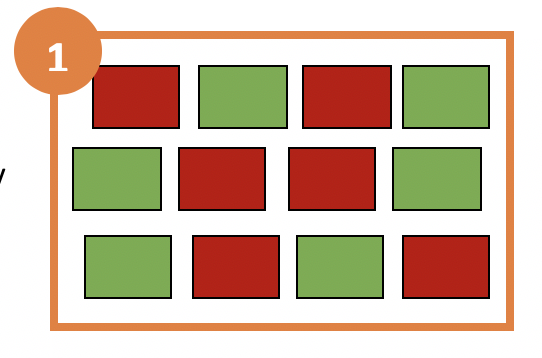
Step 1: Find Forces
On individual post-its, we will list forces in the system that currently exist. This is a brainstorming exercise, therefore please list whatever comes to mind. The only rule is that it actually exists and does so right now.
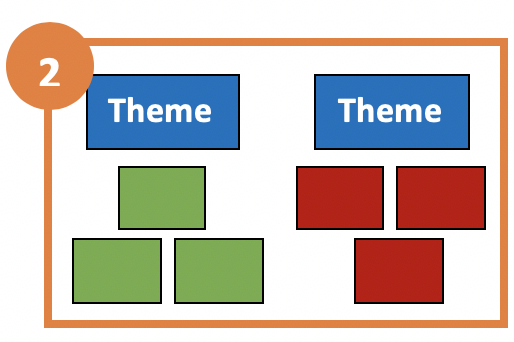
Step 2: Group into Themes
We will then group similar forces together. Each group of forces will be categorized and named. We call these groups themes.
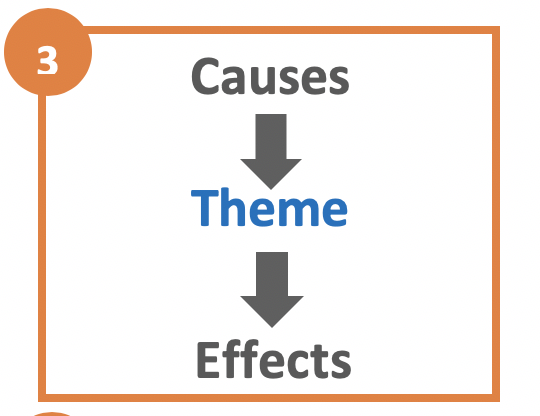
Step 3: Look at Cause & Effect
Once we have our themes, we will take each theme individually and list things that cause the theme to exist (upstream). We will also list things that the theme effects (downstream). This is called an upstream-downstream chart. This chart will be very useful for informing the next and final step.
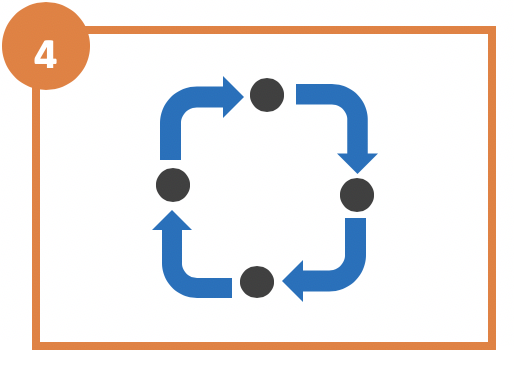
Step 4: Create Loops
Finally, we will use our upstream-downstream charts to help us discover what patterns exist. These patterns are stories explaining why certain aspects of the issue continue to repeat. We call these patterns “loops.” They are the building blocks for our map.
In preparation for the workshop ask yourself
What helps or hurts girls of color from thriving in computer science and engineering?